Valuation Discipline in a Volatile Stock Market
How to separate sentiment from fundamentals in a volatile stock market using structured valuation analysis.

A structured approach to valuation in a volatile stock market.
Image Source: ChatGPT
Valuation Discipline in a Volatile Stock Market
Written by Deane Biermeier, CFEd · Edited by Paul J. Paquin, Founder & CEO
In a volatile stock market, price movements can accelerate quickly as narratives shift and investor expectations adjust. Headlines often focus on daily swings, sector rotations, or emerging technologies.
However, valuation requires a structured framework that separates sentiment from financial evidence.
A declining share price alone does not determine whether a company is undervalued. Likewise, a rising price does not confirm strength. Analytical discipline becomes especially important during periods of heightened volatility, when multiple compression and narrative-driven reactions can obscure underlying fundamentals.
This article outlines a neutral, multi-lens framework for evaluating companies experiencing price pressure in uncertain market environments.
A 52-Week Low Is a Data Point, Not a Diagnosis
In a volatile stock market, reaching a 52-week low is a technical milestone. It reflects that the current price is the lowest observed over the past year. It does not, by itself, confirm deteriorating business quality.
Price reflects expectations. When expectations shift—due to macroeconomic concerns, earnings revisions, regulatory developments, or technological change—valuation multiples may adjust rapidly.
Distinguishing between temporary sentiment shifts and structural business impairment is central to valuation discipline.
Multiple Compression vs. Earnings Compression
Understanding why a stock declines is often more important than the magnitude of the decline.
What Is Multiple Compression?
Multiple compression occurs when investors assign a lower valuation ratio to a company’s earnings or cash flow. For example, a firm previously trading at 30 times earnings may trade at 22 times earnings if growth expectations moderate or risk perceptions increase.
In a volatile stock market, multiple compression can occur across entire sectors, even if individual company earnings remain stable.
What Is Earnings Compression?
Earnings compression refers to actual deterioration in business performance. This may include:
- Slowing revenue growth
- Margin contraction
- Declining free cash flow
- Rising debt levels
When earnings compress alongside valuation multiples, price declines may reflect structural change rather than sentiment.
Why the Distinction Matters
A stock can decline because expectations adjust, even if the underlying business remains stable. Conversely, price weakness accompanied by weakening cash generation may signal deeper issues.
Valuation discipline requires evaluating both dimensions rather than relying solely on price charts.
A Multi-Lens Valuation Framework
Relying on a single metric can distort analysis. A structured, multi-lens approach can provide a more balanced assessment.
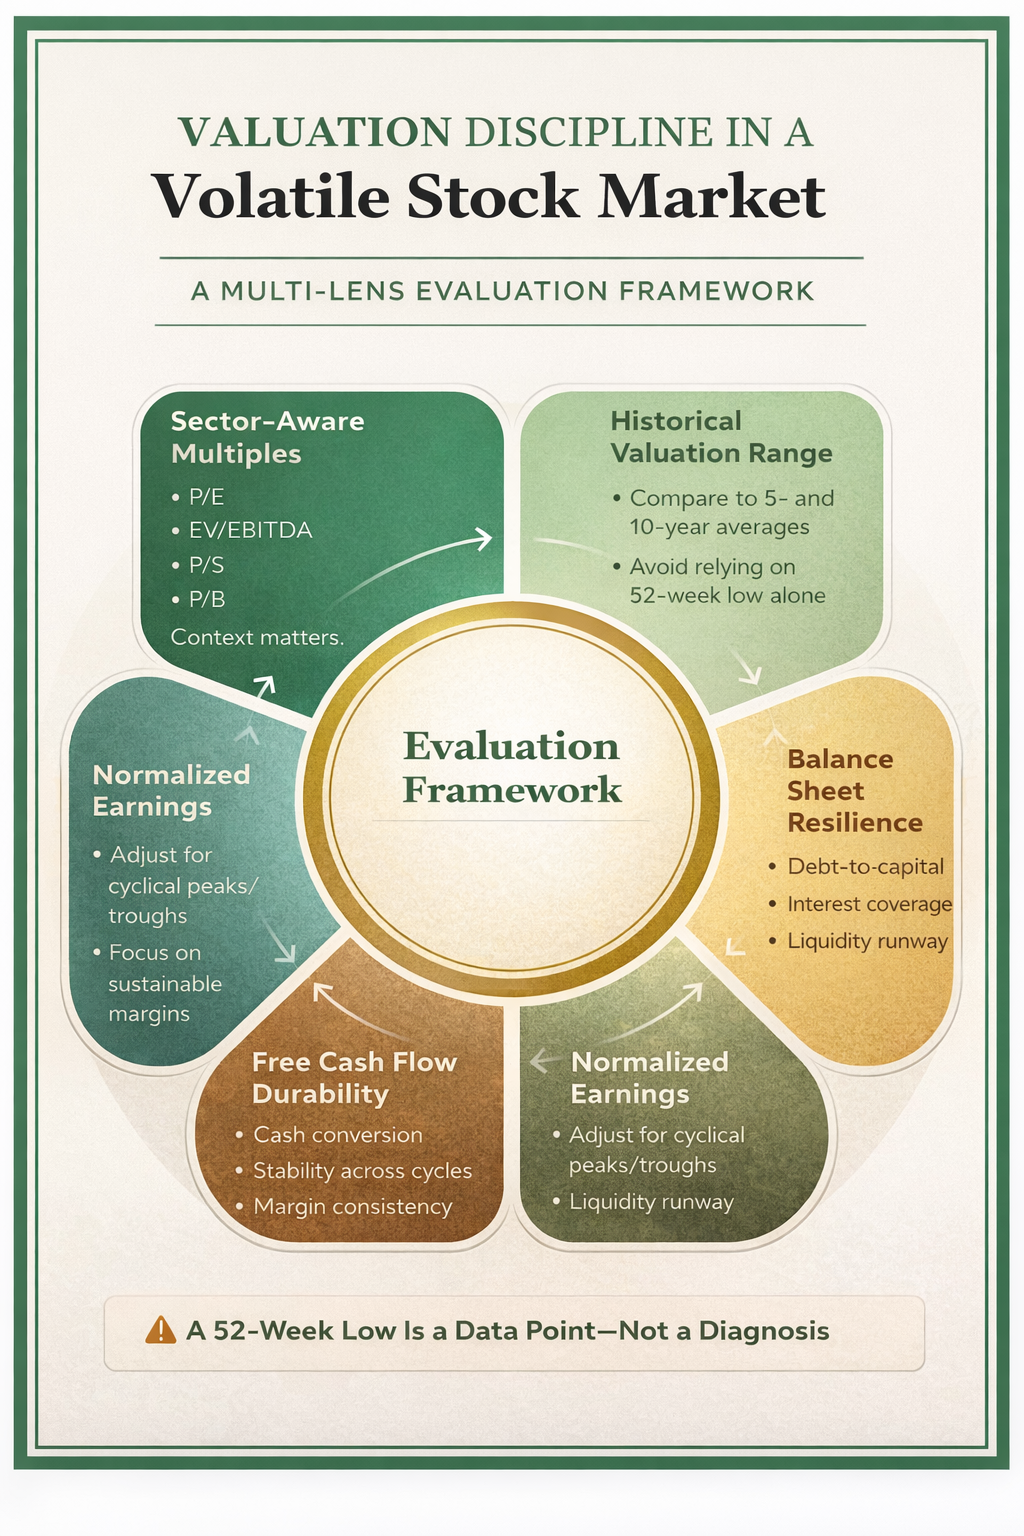
A structured, multi-lens framework for evaluating companies during periods of volatile stock market conditions.
Lens 1: Sector-Aware Multiples
Common valuation metrics include:
- Price-to-Earnings (P/E), trailing or forward
- Enterprise Value to EBITDA (EV/EBITDA)
- Price-to-Sales (P/S), particularly when earnings are temporarily depressed
- Price-to-Book (P/B), especially in asset-heavy industries
Each metric has limitations. Comparing a software firm to an industrial company using identical benchmarks may produce misleading conclusions. Sector context matters.
Lens 2: Historical Valuation Range
A stock trading near a 52-week low may still trade above its long-term average valuation band.
Comparing current multiples to five- or ten-year historical ranges can provide perspective. If a company historically traded between 15x and 20x earnings and now trades at 28x, a price decline alone does not necessarily imply undervaluation.
Conversely, if a stock trades materially below its historical range while business fundamentals remain intact, analysts may interpret that divergence as a signal for further research.
Lens 3: Normalized or Mid-Cycle Earnings
Earnings can fluctuate due to cyclical factors, one-time expenses, or temporary revenue spikes. Anchoring valuation to a single year’s earnings may misrepresent sustainable profitability.
Normalized or mid-cycle earnings estimates attempt to smooth temporary distortions. This approach can reduce the risk of overvaluing companies at peak margins or undervaluing them during cyclical troughs.
Lens 4: Free Cash Flow Durability
Free cash flow provides a direct view of cash generation after capital expenditures.
In a volatile stock market, evaluating:
- Free cash flow margins
- Cash conversion from net income
- Stability of operating cash flows can help distinguish accounting-driven earnings from durable cash generation.
A declining share price paired with stable or improving free cash flow may reflect multiple compression rather than operational deterioration. Conversely, weakening cash conversion may indicate structural pressure.
Lens 5: Balance Sheet Resilience
Leverage and liquidity are especially important during uncertain macroeconomic conditions.
Analysts often review:
- Debt-to-capital ratios
- Interest coverage
- Cash reserves
- Refinancing timelines
Rising leverage during slowing growth can amplify risk. Strong balance sheets may provide flexibility to navigate volatility without dilutive financing or constrained investment.
Technological Disruption Narratives and Valuation
Periods of innovation often coincide with heightened market volatility. New technologies can alter user interfaces, pricing structures, or competitive dynamics.
However, technological change does not automatically imply system replacement. In many cases, established platforms operate as systems of record, with embedded workflows, compliance layers, and switching costs.
In a volatile stock market, narrative shifts can outpace measurable financial impact. Monitoring revenue trends, margin stability, and cash generation may provide more reliable indicators than headline momentum alone.
Identifying Potential Value Traps
Not all price declines represent opportunity. Certain indicators may warrant additional caution:
- Structural revenue deceleration rather than cyclical softness
- Margin compression without stabilization
- Rising leverage while growth slows
- Weak cash conversion relative to reported earnings
- Valuation multiples that remain elevated relative to historical norms
Evaluating these factors collectively can reduce the risk of mistaking deterioration for discount.
Bringing the Lenses Together
No single metric determines value. A credible valuation assessment typically considers:
- Multiple trends relative to historical ranges
- Earnings durability across cycles
- Free cash flow stability
- Balance sheet strength
- Competitive positioning
In a volatile stock market, disciplined analysis can help separate temporary sentiment shifts from lasting structural change.
Bottom Line: When Stocks Trading at a 52-Week Low Are Legitimately UndervaluedFrom Paul Paquin, Founder of TrustedCompanyReviews.com A 52-week low is a data point, not a diagnosis. Situations may warrant deeper research when a stock reaches its 52-week low while valuation multiples—such as P/E and P/B—are simultaneously trading below their five- and ten-year historical averages. When entire sectors experience multiple compression, macro-level sentiment shifts may contribute to price declines beyond company-specific fundamentals.” Recent volatility in segments of the software sector illustrates how narrative-driven concerns, including those related to artificial intelligence, can influence valuation multiples. In our March Investing Guide, we highlight how companies such as Microsoft (MSFT) and S&P Global (SPGI) continue to demonstrate stable financial profiles and resilient balance sheets despite broader sector re-rating. This disciplined framework parallels the “Graham Number” introduced by Benjamin Graham in his classic book, The Intelligent Investor. Graham suggested a rule of thumb for defensive investors: the product of the P/E ratio and the P/B ratio should not exceed 22.5. Combining historical valuation analysis with structured risk limits may help investors distinguish between potential value traps and situations that warrant further research. |
Conclusion: Process Over Prediction
Market volatility can amplify short-term narratives. Valuation discipline emphasizes structure over speculation and process over prediction.
A 52-week low is a starting point for analysis, not a conclusion. By applying a multi-lens framework, market participants can evaluate price movements within a broader financial context, reducing reliance on headlines and emotional reactions.
Educational analysis does not eliminate risk. It can, however, provide a more consistent method for interpreting market fluctuations during periods of uncertainty.
Also See: 5 Potentially Undervalued Index Funds for Long-Term Investors to Research in May 2026