
New valuation data in May 2026 points toward several international and small-cap index funds trading at relatively attractive long-term prices.
Story:
What the Valuation Data — and Vanguard’s Own 10-Year Forecasts — Actually Show
MAY 2026 · MARKET INSIGHTSWritten by Deane Biermeier, Certified Financial Educator, with analytical contributions from Paul J. Paquin, Founder, at TrustedCompanyReviews.com. Data sources: Vanguard fund profile pages · Vanguard Capital Markets Model (VCMM) March 2026 · Morningstar · MSCI Index Fact Sheets · Investing.com · Star Capital Global Market Valuation |
A recurring question among long-term investors is deceptively simple: where in the global market might new money be most attractively priced today? Answering it well requires stepping back from short-term price movement and examining the underlying data — what investors are currently paying relative to earnings, book value, earnings growth, and profitability.
This report draws on a multi-metric valuation framework built from current data across 23 broad index funds, cross-referenced against Vanguard’s March 2026 Capital Markets Model (VCMM) forecasts. Those forecasts independently project 10-year nominal returns across major asset classes using 10,000 Monte Carlo simulations run as of December 31, 2025. The convergence between the two approaches — bottom-up valuation metrics and top-down long-term return forecasting — forms the analytical backbone of the five fund profiles below.
This article is educational commentary, not a recommendation to buy or sell any security. Valuation data reflects what the market is pricing in today; it does not predict returns over any given short-term horizon. The funds profiled here are intended as a starting point for research, not a finish line.
Note to ReaderAll valuation data is sourced from Vanguard fund profile pages, Morningstar, Investing.com, and MSCI Index fact sheets as of April 2026. Vanguard VCMM 10-year forecasts are from the Vanguard Investment Strategy Group’s March 2026 Market Perspectives report. See the Disclosures section for full attribution. |
The Framework: Why Valuation Without Context Is Incomplete
The most common mistake when evaluating valuation metrics is treating them in isolation. A price-to-earnings (P/E) ratio tells you what investors are currently paying per dollar of annual earnings. A price-to-book (P/B) ratio compares the market price to a company’s net asset value. Both are useful starting points — but neither is complete without three additional questions:
- Is this P/E high or low relative to this fund’s own history?
- Are the underlying companies growing their earnings quickly enough to justify the current price?
- How efficiently are those companies converting investor capital into profit — that is, what is their return on equity (ROE)?
A market can trade at the same P/E it did 20 years ago and represent better value — if the underlying companies are now significantly more profitable and growing faster. Conversely, a low absolute P/E does not always signal value if earnings are shrinking or structural headwinds are building.
The five funds below scored highest on a composite model that weighted all of these dimensions: P/E vs. historical average, P/B vs. historical average, PEG-like ratio (P/E divided by EPS growth rate), ROE trend, and dividend yield. Results were cross-referenced against Vanguard’s VCMM 10-year return forecasts for independent confirmation.
EducationThe “PEG-like ratio” divides P/E by earnings growth rate. A value below 1.0 suggests growth may exceed what the current price implies. Above 2.0 suggests the opposite — growth is already baked in. It is a directional tool, not a precise signal. |
What Vanguard’s Capital Markets Model Says About the Next Decade
Vanguard’s Investment Strategy Group publishes long-term return forecasts quarterly using its proprietary Capital Markets Model (VCMM). The December 2025 running of the model — published in Vanguard’s March 2026 Market Perspectives report — provides a valuable independent check on our bottom-up valuation signals. The table below summarizes 10-year annualized nominal return forecasts for the asset classes most relevant to the funds in this report.*
| Asset Class | VCMM 10-Yr Forecast |
Context |
| U.S. equities | ~3%–5% nominal | Elevated valuations compress forward returns |
| Global ex-U.S. equities (unhedged) | ~5%–7% nominal | Lower starting valuations imply higher expected returns |
| Developed ex-U.S. equities (unhedged) | ~5%–7% nominal | Europe, Japan, Canada: cheaper multiples, improving profitability |
| Emerging markets equities (unhedged) | ~4%–6% nominal | Wider range due to political/currency risk; quality improving |
| U.S. value | ~6%–8% nominal | Highest domestic equity forecast; valuation compression limited |
| U.S. small-cap | ~5%–7% nominal | Higher expected return vs. large-cap reflects compressed relative valuations |
| U.S. growth | ~2%–4% nominal | Lowest equity forecast; already-elevated multiples limit forward returns |
*Source: Vanguard Investment Strategy Group, March 2026 Market Perspectives. Forecasts are hypothetical, derived from 10,000 Monte Carlo simulations as of December 31, 2025. There are no guarantees of future results.
Two observations from the VCMM forecasts stand out. First, U.S. growth equities — the asset class dominating headlines for the past decade — carry Vanguard’s lowest 10-year return forecast among equity categories, reflecting today’s elevated multiples. Second, U.S. value equities carry Vanguard’s highest domestic equity forecast, and global ex-U.S. equities broadly show higher expected returns than the overall U.S. market. These are not contrarian predictions — they are the mathematical consequence of today’s starting valuations.
The macro backdrop supports this picture. Vanguard’s March 2026 report projects that the Federal Reserve will deliver only a single rate cut in 2026 as growth remains firm and inflation eases toward approximately 2.6% by year-end — a constructive environment for earnings across the funds profiled below.
VCMM NoteVanguard’s VCMM forecasts reflect a 2-percentage-point range around the 50th percentile for equities. More extreme outcomes are possible. These forecasts are probabilistic distributions, not point predictions. Source: Vanguard Investment Strategy Group, March 2026. |
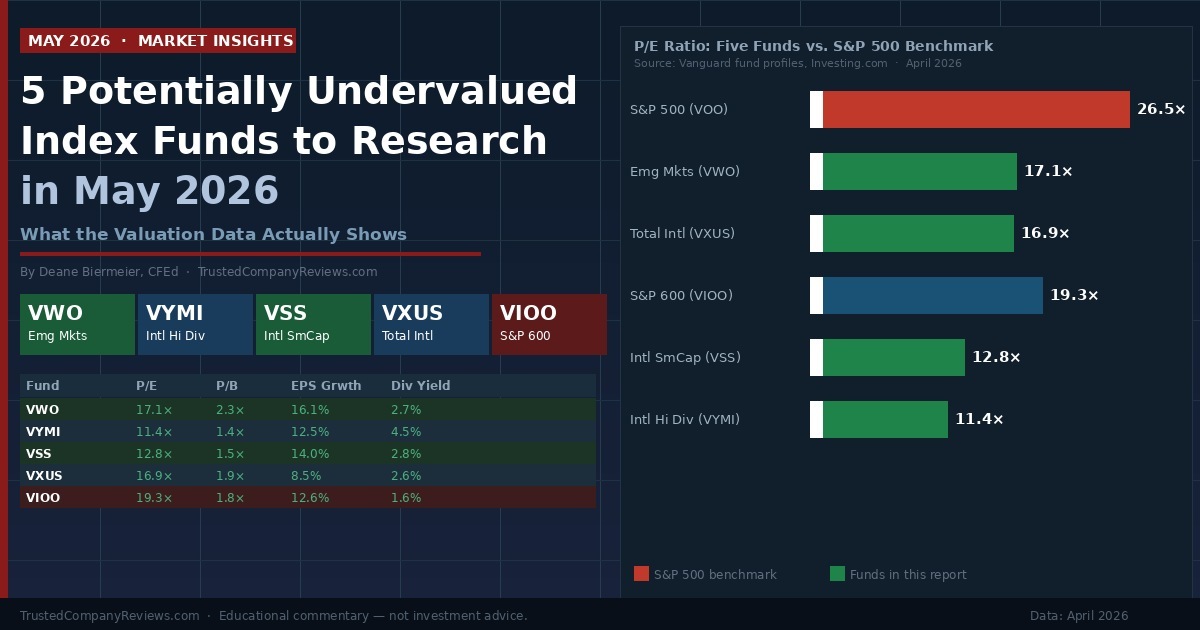
This infographic compares P/E ratios, dividend yields, and earnings growth data for five index funds that currently trade at lower valuations than the broader S&P 500 benchmark.
5 Potentially Undervalued Index Funds: Composite Valuation Summary (April 2026)
All data as of April 2026. Sources: Vanguard fund profile pages, Investing.com, Morningstar, MSCI.
| Fund Name |
Ticker |
P/E | P/B | EPS Growth | Div Yield |
Verdict |
| Vanguard FTSE Emerging Markets ETF |
VWO |
17.1× | 2.3× | 16.1% | 2.7% |
✅ Favorable |
| Vanguard Intl High Dividend Yield ETF |
VYMI |
11.4× | 1.4× | 12.5% | 4.5% |
🟢 Cheap |
| Vanguard FTSE All-World ex-US Small-Cap ETF |
VSS |
12.8× | 1.5× | 14.0% | 2.8% |
🟢 Cheap |
| Vanguard Total International Stock ETF |
VXUS |
16.9× | 1.9× | 8.5% | 2.6% |
✅ Favorable |
| Vanguard S&P Small-Cap 600 ETF |
VIOO |
19.3× | 1.8× | 12.6% | 1.6% |
✅ Favorable |
P/E = trailing 12-month price-to-earnings. P/B = price-to-book. EPS Growth = estimated annualized earnings growth. Div Yield = trailing dividend yield. Verdict reflects composite multi-factor score. This is not a recommendation.
1. Vanguard FTSE Emerging Markets ETF (VWO)
P/E 17.1× · P/B 2.3× · EPS Growth ~16% · Yield 2.7% · ROE ~16%
VWO tracks a custom FTSE index spanning more than 5,000 holdings across China (approximately 25–30% weight), Taiwan, India, Brazil, and South Africa. At 0.08%, its expense ratio is one of the most cost-effective available for broad emerging markets exposure.
The valuation case is best understood through a historical comparison. The table below sets today’s metrics against where emerging markets stood at the end of 2003 — the start of one of the strongest multi-year runs the asset class has produced.
| Metric |
MSCI EM (2003) |
VWO (Apr 2026) |
What Changed? |
| P/E Ratio |
~15× |
17.1× |
Modestly higher — quality of earnings dramatically improved |
| P/B Ratio |
~1.9× |
2.3× |
Higher, but driven by better ROE — not speculation |
| Return on Equity |
~10% |
~16% |
60% improvement in capital efficiency |
| EPS Growth |
Modest |
~16% |
Mid-teen growth vs. flat post-crisis environment |
| Dividend Yield |
~2.3% |
2.7% |
Higher income today despite price appreciation |
Sources: MSCI Emerging Markets Index historical fact sheets; Vanguard VWO fund profile (April 2026); Morningstar.
At first glance, VWO appears modestly more expensive than the 2003 entry point. But the businesses generating those earnings are fundamentally different. Return on equity has improved from roughly 10% to approximately 16% — meaning the index companies now convert investor capital into profit at a rate 60% higher. EPS growth has moved from flat post-crisis conditions to approximately 16% annualized, and the dividend yield is actually higher today. A higher multiple on a materially more profitable set of businesses is not necessarily a worse deal.
Vanguard’s VCMM places emerging markets equities at approximately 4–6% annualized 10-year nominal returns — above its U.S. equity forecast. On the macro side, Vanguard projects China GDP growth of 4.5% with core inflation of just 1.0% — a constructive backdrop for earnings multiples. India and Brazil, also significant VWO weights, continue to benefit from structural demographic tailwinds.
Key risks: China remains approximately 25–30% of VWO’s weight. Geopolitical tensions, regulatory unpredictability, and currency fluctuations are genuine material risks worth evaluating alongside any existing China exposure across a portfolio.
2. Vanguard International High Dividend Yield ETF (VYMI)
P/E 11.4× · P/B 1.4× · EPS Growth ~12.5% · Yield 4.5% · ROE ~14.7%
VYMI holds international stocks outside the United States expected to pay above-average dividends relative to their peer markets. Its approximately 1,300 holdings include major weights in Toyota, Roche, Shell, HSBC, and Nestlé.
By nearly every absolute valuation metric in our dataset, VYMI registers as one of the least expensive broad equity funds available. Its P/E of 11.4 is among the lowest across all 23 funds tracked. Its P/B of 1.4 applies only a modest premium to the net asset value of the underlying businesses. Its trailing dividend yield of 4.5% is the highest of any broad Vanguard equity ETF in our analysis — providing meaningful income return even during periods when price appreciation is modest.
The PEG-like ratio for VYMI falls comfortably below 1.0, suggesting underlying earnings growth is outpacing what investors are currently paying. In a market environment where most large-cap U.S. funds carry PEG-like ratios above 2.0, this reading warrants attention from value-oriented observers.
The macro backdrop for VYMI’s core holdings is constructive. Vanguard projects the euro area at 1.2% GDP growth with the ECB’s deposit rate falling to 2.00% by year-end — a rate-cutting environment that has historically supported dividend-paying equities. The United Kingdom shows a similar profile at 1.0% growth, with the Bank of England cutting to 3.25%.
Data PointVYMI’s P/E of 11.4 compares to the S&P 500 (VOO) P/E of approximately 26.5 as of April 2026 — a gap of more than 15 P/E points. Historically, such divergences between domestic and international valuations have eventually narrowed, though timing is unpredictable. Vanguard’s VCMM places global ex-U.S. equities at a meaningfully higher 10-year return forecast than U.S. equities. |
Risk considerations: High dividend yield funds can be interest-rate sensitive. VYMI is denominated in U.S. dollars but derives its income from international dividend payments — dollar strength or weakness relative to the euro, yen, and pound will affect USD-denominated returns.
3. Vanguard FTSE All-World ex-US Small-Cap ETF (VSS)
P/E 12.8× · P/B 1.5× · EPS Growth ~14% · Yield 2.8%
VSS tracks the FTSE Global Small Cap ex-US Index, providing exposure to small-capitalization companies across both developed and emerging international markets. With over 5,000 holdings, it is among the most diversified equity ETFs available at any price point.
VSS currently trades at a P/E of 12.8 and a P/B of 1.5 — both near the lower end of its historical range. Its estimated EPS growth rate of approximately 14% produces a PEG-like ratio well below 1.0, one of the most favorable readings across all 23 funds in our dataset. The trailing yield of 2.8% adds an income component that provides a partial return floor.
The academic case for international small-cap investing is grounded in the documented “size premium” — the tendency of smaller companies to produce higher long-term returns than large-caps, particularly when purchased at reasonable valuations. The evidence for this premium is arguably stronger in international markets than domestically, where mega-cap technology companies have compressed the relationship in recent years.
For investors seeking international exposure beyond the large-cap names that dominate VEA or VXUS — ASML, Toyota, Nestlé, Samsung — VSS provides a fundamentally different slice of the global economy: regional manufacturers, domestic consumer companies, specialty industrials, and local financial services firms operating in less-analyzed markets.
Vanguard’s VCMM places developed ex-U.S. equities at approximately 5–7% annualized 10-year nominal returns. VSS, with its smaller-cap bias and lower current multiples, may carry incremental return potential above that range over a full cycle — though with correspondingly higher short-term volatility.
Key risk: International small-cap stocks carry higher volatility than large-cap international funds, and individual holdings tend to be less liquid. VSS suits investors with long-term horizons who can tolerate short-term drawdowns.
4. Vanguard Total International Stock ETF (VXUS)
P/E 16.9× · P/B 1.9× · EPS Growth ~8.5% · Yield 2.6%
VXUS tracks the FTSE Global All Cap ex-US Index and is the most comprehensive single fund for international equity exposure in Vanguard’s lineup. With approximately 8,700 holdings spanning 47 countries — roughly 75% developed markets and 25% emerging — it is the international equivalent of VTI’s domestic coverage.
The valuation gap between VXUS and the U.S. market has been building for years, driven primarily by the extraordinary outperformance of U.S. technology companies. VXUS trades at a P/E of 16.9 versus approximately 26.5 for the S&P 500 — a difference of nearly 10 P/E points. On price-to-book, the gap is wider still: VXUS at 1.9 versus the S&P 500 at approximately 4.7.
Vanguard’s VCMM places global ex-U.S. equities at approximately 5–7% annualized 10-year nominal returns — materially above the roughly 3–5% forecast for U.S. equities. This divergence directly reflects the valuation gap: lower starting prices imply higher expected returns over a full cycle, all else equal. For investors already holding a meaningful U.S. position, VXUS functions as a natural complement — providing exposure to economies and sectors genuinely distinct from U.S. large-cap technology.
VCMM AlignmentVanguard’s March 2026 Market Perspectives projects global ex-U.S. equities at approximately 5–7% annualized 10-year nominal returns vs. approximately 3–5% for U.S. equities overall, and approximately 2–4% for U.S. growth. Source: Vanguard Investment Strategy Group. |
Risk considerations: VXUS carries foreign currency risk, country-specific risks, and exposure to geopolitical developments across 47 markets. Vanguard’s March 2026 report notes that near-term disruptions in energy-exposed international markets — including developments around the Strait of Hormuz — remain a variable to monitor, though markets currently appear to be pricing in a temporary rather than lasting disruption.
5. Vanguard S&P Small-Cap 600 ETF (VIOO)
P/E 19.3× · P/B 1.8× · EPS Growth ~12.6% · Yield 1.6%
VIOO is the only domestic U.S. fund in the top five — and it earns its place on a combination of relative valuation and index construction quality. Where the Russell 2000 includes all small-cap stocks regardless of profitability, the S&P 600 applies an earnings screen: companies must demonstrate four consecutive quarters of positive earnings before inclusion. This profitability filter matters.
Academic research on the small-cap premium has consistently found it concentrated almost entirely in profitable small-cap companies. The Russell 2000’s inclusion of unprofitable firms has historically been a drag on the index — particularly during periods of tightening credit, when cash-burning companies face the sharpest headwinds. VIOO’s construction effectively targets the profitable subset that drives the premium while avoiding that drag.
At a P/E of 19.3, VIOO trades at a modest discount to its own 10-year average and well below the S&P 500’s current multiple. U.S. small-cap stocks have broadly underperformed large-cap stocks since approximately 2017, an extended period of relative compression. Vanguard’s VCMM places U.S. small-cap at approximately 5–7% annualized 10-year nominal returns — above large-cap and significantly above growth equities — reflecting the relative valuation gap. At 0.10%, the expense ratio is low for small-cap exposure.
Key risks: Small-cap stocks are more sensitive to domestic credit conditions and economic momentum than large-caps. A prolonged high-interest-rate environment or recession scenario would create headwinds for this category. VIOO is best evaluated as a long-term complement to a core large-cap position.
Previous Reports:
Related Articles:
- SOTP Valuation: Is the True Value of Tech Stocks Hidden in Plain Sight?
- Valuation Discipline in a Volatile Stock Market
The Macro Backdrop: Vanguard’s Region-by-Region Outlook
The individual fund profiles above are strengthened by the macro context from Vanguard’s March 2026 Market Perspectives report. The table below summarizes Vanguard’s year-end 2026 economic forecasts for major countries, along with their relevance to the funds in this report.
| Country |
GDP Growth |
Unemployment | Core Inflation | Policy Rate |
Investor Context |
| China |
4.5% |
5.1% | 1.0% |
1.20% |
Cheap valuation + policy easing support |
| Euro area |
1.2% |
6.3% | 1.8% |
2.00% |
ECB cutting; cheap vs. US; VEA/VXUS exposure |
| United States |
2.5% |
4.2% | 2.6% |
3.40% |
Strong AI capex; cautious Fed; 1 cut expected |
| Japan |
1.0% |
2.4% | 2.0% |
1.25% |
Wage growth emerging; BOJ normalizing slowly |
| United Kingdom |
1.0% |
5.0% | 2.6% |
3.25% |
Stable; BoE cutting; part of VEA/VXUS |
Source: Vanguard Investment Strategy Group, March 2026 Market Perspectives. GDP growth = annual change in real GDP. Unemployment = December 2026 rate. Core inflation = year-over-year CPI ex-food and energy, December 2026. Policy rates are year-end central bank target rates.
Two macro observations are worth highlighting. First, China’s combination of 4.5% GDP growth and just 1.0% core inflation — among the most benign inflation environments of any major economy — provides a constructive backdrop for the approximately 25–30% of VWO directly exposed to Chinese equities. Second, the broadly declining rate environment across Europe (ECB target: 2.00%) and the UK (3.25%) tends to support the dividend-paying characteristics of VYMI and the international exposure within VXUS and VSS.
For the U.S., Vanguard projects solid growth of approximately 2.5% with a single Fed rate cut expected in 2026 — a domestic economy with healthy aggregate demand, but not one offering the cyclical tailwind that a more aggressive cutting cycle would provide. That context is relevant to evaluating VIOO’s small-cap earnings growth of 12.6%.
What This Analysis Does Not Tell You
Valuation data and long-term return forecasts are powerful tools for evaluating relative opportunity across markets. They carry genuine limitations that every investor should understand.
- Valuation-based approaches work over long periods — typically five to ten years or more. In the short term, even markets trading at attractive valuations can continue underperforming as capital flows, sentiment, and macro conditions dominate. Long time horizons are the appropriate frame for this type of analysis.
- Asset allocation context matters. A fund that scores well on valuation metrics may not be appropriate for a specific portfolio if it creates geographic concentration, style overlap, or currency exposure that conflicts with existing holdings.
- Currency risk is real for all four international funds. VYMI, VSS, VXUS, and VWO are denominated in U.S. dollars but generate returns from assets priced in foreign currencies. A period of sustained dollar strength can reduce USD-denominated returns even when underlying market performance is positive.
- Tax efficiency varies by account type. Several of the funds above generate foreign dividend income with foreign tax credit implications in taxable accounts. Consult a qualified tax professional for guidance specific to your situation.
- This is not investment advice. TrustedCompanyReviews.com is a publisher, not a registered investment advisor. No content on this site constitutes a personalized recommendation.
How to Verify and Update the Data in This Report
The following are the primary sources used for the data above, along with guidance on how to access current figures as they change.
- Vanguard fund profile pages (investor.vanguard.com): Search for any fund ticker, select the Portfolio tab, and scroll to “Portfolio Characteristics” for current P/E, P/B, earnings growth rate, and dividend yield.
- Morningstar (morningstar.com): For ROE, revenue growth, and profitability metrics under the Financials and Ratings tabs.
- MSCI Index Fact Sheets (msci.com): Free PDF downloads for MSCI World, EAFE, and Emerging Markets indexes, including historical P/E, P/B, dividend yield, and earnings growth going back 20+ years.
- Vanguard Capital Markets Model forecasts: Published quarterly at advisors.vanguard.com/insights/article/series/market-perspectives, updated each quarter using VCMM simulations.
- Star Capital Global Market Valuation (starcapital.de): Current and historical P/E and CAPE ratios for approximately 40 country stock markets.
multpl.com and gurufocus.com/shiller-pe: U.S. Shiller CAPE data going back to the 1880s — essential context for any long-term U.S. market valuation discussion.
A Final Word
Every market cycle produces periods where capital concentrates in high-performing assets, pushing valuations above historical norms — while other markets, segments, or categories reach levels that long-term investors have historically found worth examining. Multiple independent data sources suggest we are in such a period today.
Vanguard’s VCMM projects materially higher 10-year expected returns for international equities, U.S. value, and U.S. small-cap than for U.S. large-cap growth — a direct mathematical consequence of today’s starting valuations. Our own multi-metric scoring model, built from current P/E, P/B, EPS growth, ROE, and dividend yield data across 23 broad index funds, produces a broadly consistent ranking.
None of this implies that the funds profiled above will outperform over any given period. Markets can remain expensive for years. Assets trading at attractive levels can become more so. What valuation data provides is a framework for thinking about probabilities — not certainties — over long time horizons. For investors building or maintaining portfolios for goals that are five, ten, or twenty years away, this report offers one lens through which to evaluate where new capital might be most productively deployed. We will continue updating this database as valuations, earnings growth rates, and macro conditions evolve.
Important Disclosures & Financial Disclaimer
- Educational Purposes Only: TrustedCompanyReviews.com (TCR) is a publisher, not a registered investment advisor. This article is for informational and educational purposes only and does not constitute personalized financial advice.
- No Guarantees: Past performance is not indicative of future results. Valuation metrics and economic forecasts are as of April 2026 and are subject to change. Vanguard VCMM projections are hypothetical and do not guarantee future results.
- Third-Party Sources: Vanguard Capital Markets Model (VCMM) forecasts are produced by Vanguard’s Investment Strategy Group and are cited here for educational context only. See advisors.vanguard.com for full methodology and disclosures.
- Conflicts of Interest: TCR, its owners, or contributors may hold long positions in securities mentioned. All commentary is produced with editorial independence.
Updated: April 2026. This article will be refreshed as new valuation data, Vanguard VCMM quarterly updates, and MSCI Index Fact Sheet data become available.