Is the Stock Market in a Bubble in 2026? What 2006 and 2017 Can Teach Investors
Stock market bubble concerns are rising in 2026 as high valuations, market concentration, and AI investment echo warning signs seen in previous market cycles.

Written by
Deane Biermeier
Contributor
Paul J Paquin
Are Today’s Markets Showing Signs of a Bubble?
Valuation, leverage, market concentration and speculative behavior point to elevated risk, but the 2026 setup differs materially from prior bubble periods.
Updated Tue, 28 Aug 2026
Written by Deane Biermeier, Certified Financial Educator, with analytical contributions from Paul J. Paquin, Founder and CEO at TrustedCompanyReviews.com.
Is the Stock Market in a Bubble in 2026?
The question “is the stock market in a bubble in 2026?” has become more relevant as U.S. equity valuations, mega-cap concentration and artificial-intelligence infrastructure spending have all moved higher. The answer is not a simple yes or no. Market bubbles are usually identified only in hindsight, and expensive markets can remain expensive for years.
A more useful approach is to compare today’s conditions with earlier periods and ask which warning signs are present. The 2006 cycle was driven primarily by housing, mortgage credit and leverage. The 2017 cycle combined elevated equity valuations with exceptionally low volatility and intense cryptocurrency speculation. In 2026, the most visible risks are unusually high U.S. equity valuations, heavy index concentration and a historic capital-spending cycle tied to AI.
This report uses a capital-cycle framework: when strong returns attract more capital, competition, leverage and investment often follow. Those forces can eventually reduce future returns even when the underlying technology or business trend remains real.
Also Read: Market Analysis March 2026 – 10 Blue-Chip Companies to Research
What Is a Bubble in the Stock Market?
A market bubble generally develops when asset prices rise substantially faster than the underlying cash flows, earnings or economic value that ultimately support them. Bubbles are often reinforced by easy financing, extrapolation of recent returns, new financial products, rising leverage and the belief that traditional valuation measures no longer matter.
No single indicator proves that a bubble exists. A high P/E ratio can reflect unusually strong business quality. Low volatility can persist. Rapid capital spending can produce attractive returns when demand is real. The risk rises when several of these conditions appear at the same time.
Also Read: Are We in a Recession? What It Could Mean for Your Retirement and Finances
2006, 2017 and 2026: Three Different Bubble Setups
Period | Primary excess | Valuation signal | Other warning signs | What happened next |
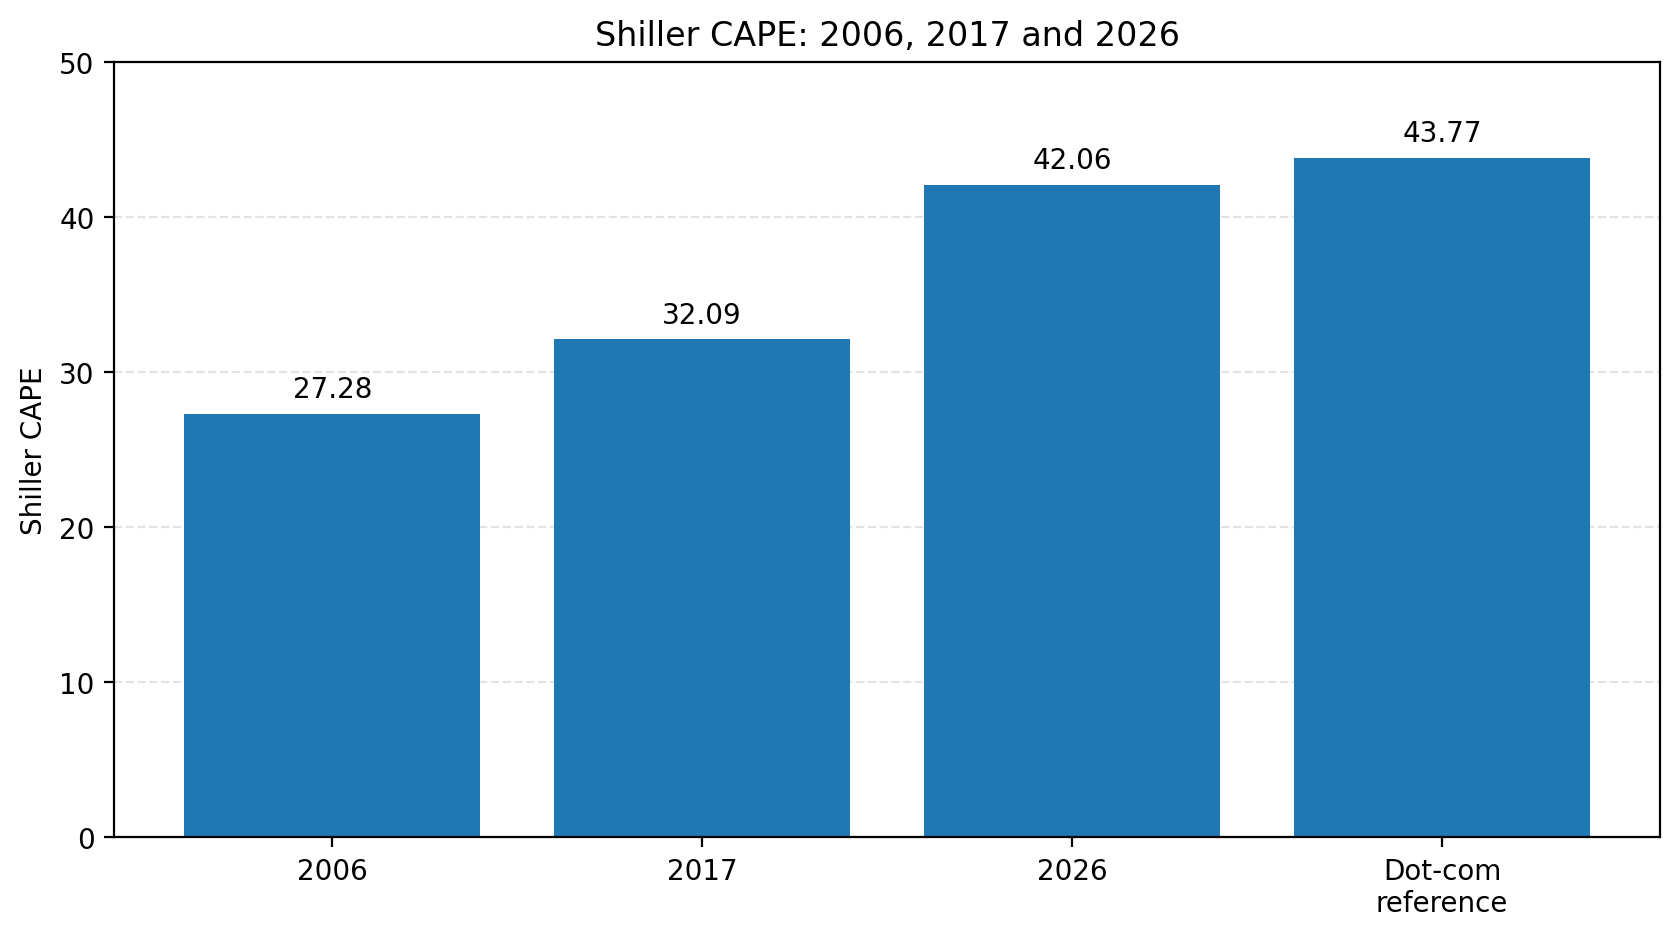
2006 | Housing, mortgage credit and leveraged finance | Shiller CAPE 27.28 (Dec. 1, 2006) | Mortgage debt reached 97% of GDP; housing prices had more than doubled from 1998 to 2006; VIX averaged 12.8 | Housing peaked, mortgage losses spread through the financial system, and the 2007–09 crisis followed. |
2017 | Low volatility, elevated valuations and cryptocurrency speculation | Shiller CAPE 32.09 (Dec. 1, 2017) | VIX averaged 11.6 through June; bitcoin rose more than 1,700% during 2017 | Crypto prices reversed sharply, and equity volatility returned in 2018, although the broader stock market did not experience a 2008-style collapse. |
2026 | AI-linked valuation, concentration, capex and financing | Shiller CAPE 42.06 (Aug. 18, 2026) | Top 10 S&P 500 weight 37.6% as of July 31; hyperscaler bond issuance about $194B through July 7, up 79% year over year | Unknown. The current question is whether AI-linked earnings ultimately justify the capital being deployed. |
These periods are not identical. In 2006, the key danger was leverage embedded in housing and the financial system. In 2017, complacency and speculative enthusiasm were especially visible in volatility markets and cryptocurrency. In 2026, valuation and concentration stand out, while the largest technology companies remain highly profitable and generate substantial cash flow.
Chart: Shiller CAPE Across Three Market Cycles
What Makes 2026 Different?
1. Valuation Is Historically High
The Shiller cyclically adjusted P/E ratio reached 42.06 on Aug. 18, 2026. For context, it was 43.77 on Jan. 1, 2000. The conventional S&P 500 trailing P/E was approximately 29.71 on Aug. 19, 2026. These figures place broad U.S. large-cap valuation near the upper end of modern history.
Valuation does not identify the date of a market peak. It can, however, influence subsequent long-term returns if earnings growth slows or valuation multiples normalize.
2. Market Leadership Is Highly Concentrated
As of July 31, 2026, the 10 largest companies represented 37.6% of the S&P 500. Information technology alone represented 36.8% of the index. Concentration does not automatically imply a bubble; dominant companies can deserve large weights. But it increases the impact that a change in sentiment toward a small group of companies can have on the overall index.
3. The AI Capital Cycle Is Accelerating
The largest technology companies are committing extraordinary amounts of capital to data centers, chips, power systems and related infrastructure. Reuters reported that Amazon, Alphabet, Meta, Oracle and Microsoft had issued about $194 billion of bonds through July 7, 2026, a 79% increase from the prior year, with much of the financing tied to AI infrastructure.
That spending may ultimately prove highly productive. The capital-cycle risk is different: if competitors build capacity faster than profitable demand develops, future returns on that investment can decline even while AI adoption continues.
4. High Valuations Now Compete With Meaningful Bond Yields
As of Aug. 19, 2026, the S&P 500 earnings yield was approximately 3.37% while the 10-year Treasury yield was approximately 4.65%. The Federal Reserve’s target range stood at 3.50% to 3.75% in late August 2026.
That does not make equities unattractive in and of themselves, because stocks can grow earnings while Treasury coupons do not. It does mean that investors are paying high multiples at a time when alternatives to equities provide materially more income than they did during the near-zero-rate era.
What 2006 Still Teaches: Follow the Leverage
The defining feature of 2006 was not an extreme stock-market P/E ratio. It was the interaction of housing prices, mortgage credit and leverage. Federal Reserve History notes that average U.S. home prices more than doubled from 1998 to 2006 and household mortgage debt increased from 61% of GDP in 1998 to 97% in 2006.
That distinction matters. A bubble can develop outside the most visible stock-market valuation measures. For market observers analyzing 2026, leverage is therefore an important factor to examine wherever capital is expanding fastest, including private credit, private equity, data-center financing, utilities, infrastructure, and technology investment.
What 2017 Still Teaches: Complacency Can Be a Warning Sign
In 2017, the market combined elevated valuations with unusually low volatility. CBOE research reported an average VIX reading of 11.6 through June 2017, compared with 12.8 in 2006. Reuters reported that the VIX fell to 9.19 in July 2017, near a multi-decade low.
At the same time, bitcoin rose more than 1,700% during 2017 before experiencing a sharp reversal. The broader U.S. stock market was not necessarily one uniform bubble, but speculative behavior was clearly visible in specific areas.
Eight Market-Bubble Warning Signs to Watch
1. Valuations move far above historical norms — High valuation is not proof of a bubble, but it can reduce the margin for disappointment if earnings or growth fall short of expectations.
2. Capital floods into the recent winners — Strong past returns attract new competitors, new funds, and larger investment budgets.
3. Leverage rises faster than underlying cash flow — Borrowing can magnify returns until revenues or asset prices weaken.
4. Financing terms become easier — When lenders compete aggressively to fund deals, underwriting standards can deteriorate.
5. Market concentration increases — A narrow group of winners can make an index appear healthier than the median company.
6. New structures and financial products proliferate — Innovation can be legitimate, but late-cycle complexity often expands when demand for exposure is strongest.
7. Investors begin treating price as proof of value — Rising prices can create their own demand, even when future cash-flow assumptions become more demanding.
8. Management teams and investors extrapolate unusually strong conditions — One recurring risk in a capital cycle is the assumption that exceptional growth, margins, or financing conditions will persist.
So, Is There a Bubble in the Stock Market in 2026?
The evidence supports a more nuanced conclusion than a simple bubble declaration. U.S. large-cap equities are historically expensive by several measures, index concentration is unusually high, and the AI investment cycle is absorbing extraordinary amounts of equity and debt capital.
At the same time, many of the market’s largest companies are profitable, cash-generative businesses with established competitive positions. The U.S. banking system is also operating under a different regulatory framework than it did before the global financial crisis. And valuation is not uniformly elevated across every market segment.
A reasonable description of 2026 is therefore: an expensive and concentrated market with bubble-like conditions in selected areas, rather than proof that every stock or every asset class is in a single synchronized bubble.
TCR Education Corner: Price Is Not the Same as Value
Price Is Not the Same as Value One of the recurring lessons across market bubbles is that price and intrinsic value can move in opposite directions for extended periods. A rapidly rising price can reflect improving fundamentals, multiple expansion, speculation, or some combination of all three. In valuation analysis, market analysts often compare market price with earnings, free cash flow, balance-sheet strength, return on invested capital, and reasonable long-term growth assumptions. No single valuation metric provides a complete answer. |
Related Market Insights
• Undervalued Index Funds: Areas of the Market Trading at Lower Valuations
• Sum-of-the-Parts (SOTP) Valuation: How Investors Evaluate Complex Companies
• Valuation Discipline in a Volatile Stock Market
Frequently Asked Questions
Is the stock market in a bubble in 2026?
There are signs of bubble-like conditions in parts of the 2026 stock market, including historically high valuations, heavy concentration among the largest companies, and rapid AI-related capital spending. However, these conditions don't prove that the entire market is in a bubble, and many of today's largest companies remain highly profitable and cash-generative.
What are the biggest stock market bubble warning signs?
Common warning signs include valuations far above historical norms, increasing leverage, easier financing conditions, market concentration, speculative behavior, and large amounts of capital flowing toward recent winners. No single indicator confirms a bubble, but several appearing simultaneously can signal elevated market risk.
Does a stock market bubble mean a crash is coming?
Having a stock market bubble doesn't necessarily mean that a crash is coming. Expensive markets can remain expensive for years, and bubble-like conditions don't reveal when or whether a major decline will occur. History also shows that speculative excess can unwind in one part of the market without causing a broader financial crisis, as occurred with cryptocurrency following 2017.
How does the 2026 stock market compare with previous bubbles?
The risks are different. In 2006, housing, mortgage debt, and financial leverage were major concerns. In 2017, elevated valuations coincided with unusually low volatility and cryptocurrency speculation. In 2026, historically high equity valuations, index concentration, and massive AI-related investment stand out as the primary areas to watch.
A Final Word
Bubbles are easy to identify after they burst and difficult to identify while prices are still rising. The practical value of studying prior cycles is not to predict the exact date of the next decline. It is to identify the conditions that repeatedly reduce future returns: excessive valuation, leverage, concentrated capital flows, weakening underwriting standards and the assumption that unusually favorable conditions will persist indefinitely.
Market headlines describe price movement. The objective of this analysis is to provide context around valuation, financial conditions, capital allocation and the durability of the cash flows supporting those prices.
Important Disclosures & Financial Disclaimer
Educational Purposes Only
TrustedCompanyReviews.com (TCR) is a publisher, not a registered investment adviser. This article is for informational and educational purposes only and does not constitute personalized financial, legal, or investment advice. All investing involves risk, including the possible loss of principal. Past performance is not indicative of future results.
Market and valuation figures are date-stamped in the article because these values change over time. Readers should verify current information independently before making financial decisions.
Conflicts of Interest
TCR, its owners, or its contributors may hold long or short positions in securities or funds discussed in its market commentary. All commentary is produced with editorial independence and is intended to provide general market education rather than individualized recommendations.
Sources
• Multpl — Shiller PE Ratio by Month
• Multpl — S&P 500 P/E, earnings yield and Treasury data
• S&P Dow Jones Indices — S&P 500 characteristics and concentration
• Federal Reserve History — The Great Recession and Its Aftermath
• Reuters — 2017 volatility and bitcoin coverage
• Reuters — Hyperscaler debt issuance, July 29, 2026
• FRED — Federal Funds Target Range
• Edward Chancellor (ed.) — Capital Returns: Investing Through the Capital Cycle

Written by
Deane Biermeier
Contributor
Paul J Paquin