Oil Stocks in 2026: How Energy Companies Build Competitive Advantages
Strait of Hormuz disruptions have renewed interest in energy stocks, highlighting how rising oil prices affect energy companies differently.

Written by
Deane Biermeier
Contributor: CEO - Trusted Company Reviews
Paul J Paquin
Oil stocks are influenced by global energy prices, market conditions, and the competitive advantages of individual companies.
Disruption in the Strait of Hormuz has renewed attention on energy stocks. Understanding the oil and gas value chain helps explain why higher oil prices affect producers, pipelines, refiners, and chemical companies differently.
Key Takeaways
- Oil stocks have gained attention in 2026 as geopolitical tensions and supply disruptions drive energy prices higher.
- Not all oil stocks respond to rising prices the same way. Producers, pipeline operators, refiners, and oilfield services companies face different opportunities and risks.
- Economic moats matter. Companies with lasting competitive advantages may be better positioned to withstand falling oil prices.
- Historical performance provides valuable context. Comparing financial results across multiple oil market cycles can reveal strengths and weaknesses.
- Strong stock performance doesn't guarantee future returns. Investors should evaluate financial health, competitive advantages, and valuation before buying oil stocks.
Written by Deane Biermeier, Certified Financial Educator, with analytical contributions from Paul J. Paquin, Founder and CEO at TrustedCompanyReviews.com.
Disclosure: contributors hold positions in some companies mentioned. See full disclosures below.
What Are Oil Stocks?
Oil stocks are shares of publicly traded companies involved in producing, transporting, refining, or supporting the oil and gas industry. These include major producers such as ExxonMobil and Chevron, pipeline operators, refiners, and businesses that provide equipment and technology.
Investors often consider oil stocks for their potential growth and dividend income. However, their performance depends on factors such as oil prices, operating costs, global demand, and geopolitical events. Different types of oil stocks respond to these factors differently, making it important to understand how each company earns money.
Why Oil Stocks Are Back in Focus
Oil stocks have attracted renewed attention in 2026 as conflict in the Middle East disrupts global energy supplies and drives oil prices higher. However, rising oil prices don't necessarily make every energy company a good investment.
The U.S.-Iran conflict that began in late February disrupted shipping through the Strait of Hormuz, a critical passage for global energy supplies. In 2024, oil passing through the strait was equivalent to approximately 20% of global petroleum-liquids consumption. The strait also carried approximately 20% of global liquefied natural gas (LNG) trade.
According to the U.S. Energy Information Administration's (EIA) October 6, 2026, Short-Term Energy Outlook, Brent crude oil averaged $114 per barrel in September. The agency forecast an average of $105 per barrel for the fourth quarter, citing continued restrictions on Middle Eastern oil flows and risks to alternative export infrastructure.
Energy stocks have also experienced substantial gains. Through September 30, 2026, the Energy Select Sector SPDR Fund (XLE) returned 40.13% year to date, compared with a 12.75% total return for the S&P 500 Index. Both figures include reinvested dividends. XLE's return reflects fund expenses, while the index has no investment expenses.
Those gains raise an important question for investors. Which oil companies have competitive advantages that could help them remain profitable when oil prices eventually decline?
Higher oil prices can temporarily boost producers' earnings, but their effects on pipeline operators, refiners, and other energy businesses vary. Understanding those differences can help investors evaluate which companies may perform well across changing market conditions.
Also Read: Is the Stock Market in a Bubble in 2026? What 2006 and 2017 Can Teach Investors
What Is Happening in the Strait of Hormuz?
The Strait of Hormuz is a narrow waterway between Iran and Oman's Musandam Peninsula. It connects the Persian Gulf, home to major oil-producing countries including Saudi Arabia, Iraq, Kuwait, Qatar, and the United Arab Emirates, to the Gulf of Oman and the open ocean.
At its narrowest point, the strait is approximately 21 miles wide, with designated shipping lanes measuring only a few miles across.
Disruptions to shipping through the strait can limit global oil supplies, increase transportation costs, and contribute to higher energy prices. However, the effects vary across the oil and gas industry.
Some oil producers benefit from higher selling prices, while pipeline operators may benefit from increased demand for alternative transportation routes. Refiners and chemical manufacturers can face higher costs, supply disruptions, or changing profit margins.
Understanding these differences starts with examining how the oil and gas industry operates.
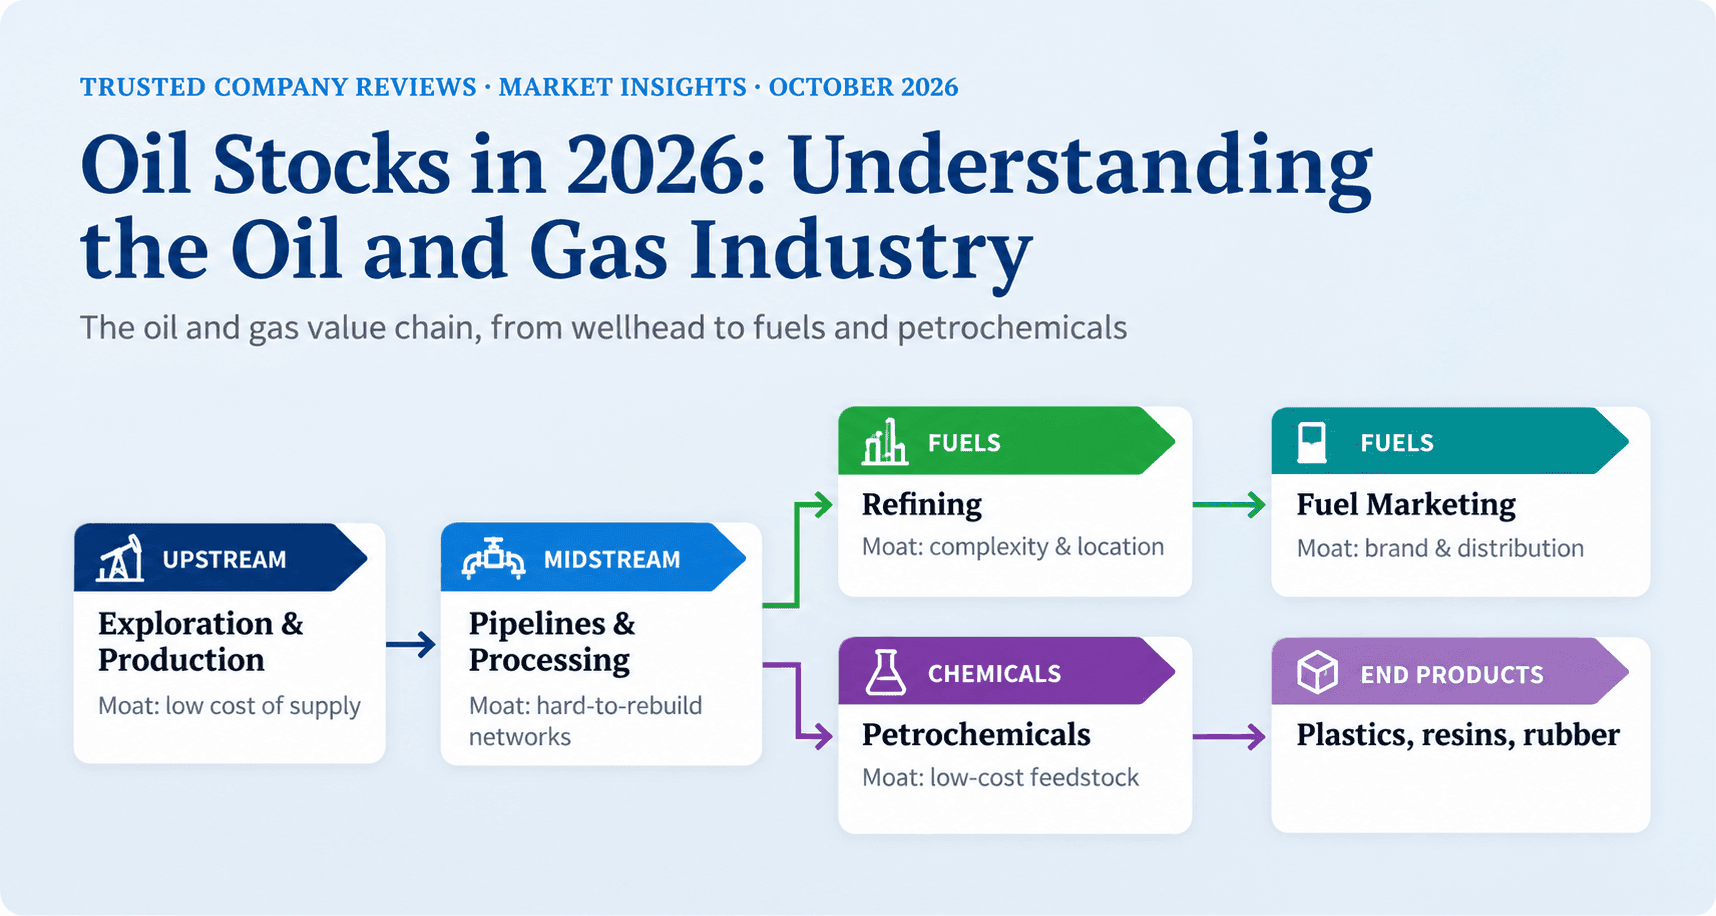
The Oil and Gas Value Chain, Explained
Petroleum takes its name from words meaning “rock oil.” Crude oil must be processed into usable products such as gasoline, diesel, jet fuel, lubricants, and chemical feedstocks.
The industry is commonly divided into three segments:
Upstream: Finding and producing crude oil and natural gas.
Midstream: Transporting, storing, and processing oil and gas.
Downstream: Refining crude oil, manufacturing petrochemicals, and marketing finished products.
These activities form an interconnected network. Refineries supply transportation fuels and chemical feedstocks, while natural gas processing also supplies feedstocks directly to petrochemical plants. Technology and service providers support operations throughout the industry.
How Do Major Oil Stocks Compare?
One way to evaluate oil stocks is to examine their return on invested capital (ROIC), which measures how efficiently a company generates profits from the money invested in its operations.
Comparing five- and 10-year average ROIC figures can help investors understand how companies have performed across changing market conditions, including periods of rising and falling oil prices.
The table below compares major energy companies across several industry segments. While higher ROIC figures can indicate stronger capital efficiency, they don't necessarily mean a company has a lasting competitive advantage or that its stock is a better investment.
Business category | Company | 5-year average ROIC, 2021–2025 | 10-year average ROIC, 2016–2025 |
Upstream and integrated producers | ConocoPhillips (COP) | 16.82% | 10.73% |
Upstream and integrated producers | ExxonMobil (XOM) | 14.60% | 9.24% |
Upstream and integrated producers | Chevron (CVX) | 11.55% | 6.94% |
Midstream | Enterprise Products Partners (EPD) | 11.75% | 10.58% |
Midstream | Kinder Morgan (KMI) | 6.11% | 4.62% |
Midstream | Enbridge (ENB) | 5.71% | 5.35% |
Refining and integrated downstream | Valero Energy (VLO) | 15.81% | 12.29% |
Refining and integrated downstream | Marathon Petroleum (MPC) | 14.90% | 9.22% |
Refining and integrated downstream | Phillips 66 (PSX) | 13.04% | 10.45% |
Petrochemicals | LyondellBasell (LYB) | 10.59% | 16.42% |
Petrochemicals | Dow (DOW) | 7.53% | N/A¹ |
Technology and services exposure | Honeywell, parent company of UOP (HON) | 13.61% | 13.89% |
Technology and services | SLB (SLB) | 11.88% | 0.92% |
Source: Morningstar Profitability & Efficiency annual ROIC figures, compiled October 21, 2026. Averages are arithmetic means of annual percentages for the stated fiscal years. Current and trailing-12-month observations are excluded. Companies are ordered within each category by five-year average ROIC, highest first. This ordering is not an investment recommendation or a ranking of valuation or moat strength.
What Gives Oil Companies a Competitive Advantage?
Some oil companies are better positioned than others to remain profitable when energy prices fall. Their ability to maintain strong financial performance often comes from competitive advantages, known in the investment industry as economic moats.
The term economic moat, popularized by investor Warren Buffett, describes a lasting advantage that helps protect a company from competitors. In the oil and gas industry, these advantages typically come from lower production costs, productive reserves, efficient operations, specialized infrastructure, or proprietary technology.
Unlike companies that can charge more because of their brand names, oil producers generally sell crude oil at market-based prices. Differences in oil quality, location, and transportation costs affect those prices, but individual producers have limited control over the market.
For investors, the important question is whether a company's advantages can help it remain competitive when oil prices decline. Examining financial performance across multiple market cycles can help identify companies with lasting strengths rather than those benefiting primarily from temporarily high prices.
Oil Producers: Why Production Costs Matter
Upstream companies find and produce oil and natural gas. Individual producers generally have limited control over market prices, making their cost of supply an important competitive factor.
Lower-cost assets can help a producer remain profitable when prices decline. Assessing that resilience requires looking beyond day-to-day operating costs to include development spending, transportation, taxes, and the investment needed to sustain production.
ExxonMobil illustrates this approach through its investments in the Permian Basin and offshore Guyana.
In its second-quarter 2026 results, released July 31, ExxonMobil reported:
Record Permian production exceeding 1.8 million oil-equivalent barrels per day.
$23.6 billion in operating cash flow for the quarter.
$5.1 billion in share repurchases for the quarter.
These figures describe production, cash generation, and capital allocation. They do not, by themselves, establish the company’s cost advantage or what it would earn at lower commodity prices.
Chevron and ConocoPhillips provide additional examples for examining production costs, reserve quality, and capital discipline. ConocoPhillips focuses on exploration and production without the refining businesses found at integrated companies such as ExxonMobil and Chevron. This creates a different mix of exposure to commodity prices and downstream margins.
How Hormuz affects this stage: Producers with operations outside the affected region may benefit from higher realized prices and buyers seeking alternative supplies. However, companies with global operations can also face regional disruption. Prolonged high prices can weaken demand, while improved shipping conditions could reduce the price premium.
Oil Pipelines: How Transportation Companies Make Money
Midstream companies own the pipelines, storage terminals, processing plants, and export docks that move oil and gas from production areas to refineries and customers. Many earn fees based on volume rather than on the price of the commodity, often under long-term contracts.
The moat comes from how difficult these networks are to replicate. Building a major new interstate pipeline in the U.S. requires years of permitting, right-of-way agreements, and capital, and many proposed projects have been delayed or canceled.
An existing, integrated network that connects production basins to Gulf Coast refineries and export terminals is therefore hard to compete with.
Enterprise Products Partners reported its 27th consecutive year of distribution growth in 2025, a record spanning both the 2014–2016 oil downturn and the 2020 pandemic.
Its 2025 distributions were covered 1.7 times by operational distributable cash flow, a partnership-defined measure. That history demonstrates resilience, but future distributions remain subject to business performance and management decisions.
How Hormuz affects this stage:
Disruption to Gulf exports can increase interest in alternative supply routes, including North American infrastructure. The financial benefit depends on each operator’s available capacity, connected production, contract terms, and actual throughput. Fee-based contracts reduce direct exposure to commodity prices but do not eliminate volume, counterparty, or financing risk.
Oil Refiners: How Refining Margins Affect Profits
Refiners buy crude oil and sell gasoline, diesel, jet fuel, and other products. Their profit depends on the "crack spread," the difference between crude oil costs and refined product prices, not on the price of oil itself.
The moat comes from complexity and location.
Complex refineries can process heavier, higher-sulfur crudes that sell at a discount and still produce high-value fuels.
Refiners on the U.S. Gulf Coast have access to domestic crude, pipeline networks, and export docks.
Valero, Phillips 66, and Marathon Petroleum operate large, complex refining systems, and Valero has also built a significant renewable diesel and sustainable aviation fuel business through its Diamond Green Diesel joint venture.
EIA identifies Marathon’s Garyville, Louisiana facility, which began operating in 1977, as the newest U.S. refinery with significant downstream processing capacity. Smaller facilities have opened since then, and existing refineries have expanded. New construction is therefore only one source of additional competition.
How Hormuz affects this stage: The disruption has removed refined product exports from Gulf refineries and tightened global fuel supplies.
Constraints on refined-product supplies can support margins at operating refineries. However, the benefit varies with crude acquisition costs, product prices, maintenance schedules, energy costs, and transportation access.
A higher crude price alone does not guarantee higher refining profits.
Refining margins are historically cyclical, however, and periods of exceptionally strong margins have usually been followed by weaker ones.
Petrochemical Stocks: Opportunities and Risks
Petrochemicals are chemicals made from oil and natural gas. Plants called steam crackers break hydrocarbons into building blocks such as ethylene and propylene, which are then made into plastics, packaging, synthetic rubber, adhesives, and many other materials.
Petrochemicals come after production and processing in the value chain, not before.
The main advantage in this segment is feedstock cost. Many U.S. plants use ethane, a natural gas liquid that has been abundant and inexpensive because of shale production.
Many plants in Europe and Asia use naphtha, a crude oil product whose cost rises with oil prices. Integrated companies such as ExxonMobil can also move molecules between refining and chemical operations to capture value.
Petrochemicals are highly cyclical.
Capacity additions can depress selling prices even when producers have advantageous feedstock costs.
In July 2025, Dow reduced its quarterly dividend from $0.70 to $0.35 per share, citing a prolonged industry downturn. The example illustrates why a cost advantage does not eliminate demand, oversupply, or dividend risk.
Higher oil prices can widen the cost advantage of U.S. ethane-based producers relative to naphtha-based competitors, but a weaker economy reduces demand for plastics and chemicals.
Oilfield Services Stocks: Investing in Industry Technology
Some companies don't produce oil at all. They sell the technology, equipment, and expertise the rest of the industry relies on.
SLB provides drilling technology, subsurface data and software, and production equipment to producers worldwide.
Honeywell's UOP business licenses refining and petrochemical process technology and sells the catalysts those processes use, which creates recurring revenue.
The moat in this segment comes from intellectual property, a large installed base, and the cost and risk customers face if they switch providers.
These businesses are tied to industry spending, which rises and falls with oil company budgets.
How Hormuz affects this stage: Effects on service companies are mixed.
Higher commodity prices can encourage investment outside the affected region, while conflict can interrupt existing operations. SLB’s second-quarter 2026 results described Middle Eastern disruption alongside growth elsewhere, illustrating why higher oil prices do not automatically translate into stronger results for every service provider.
What Past Oil Crashes Teach About Energy Moats
A company's economic moat is often tested when oil prices fall, not when they rise. Two historical downturns illustrate how differently energy businesses performed.
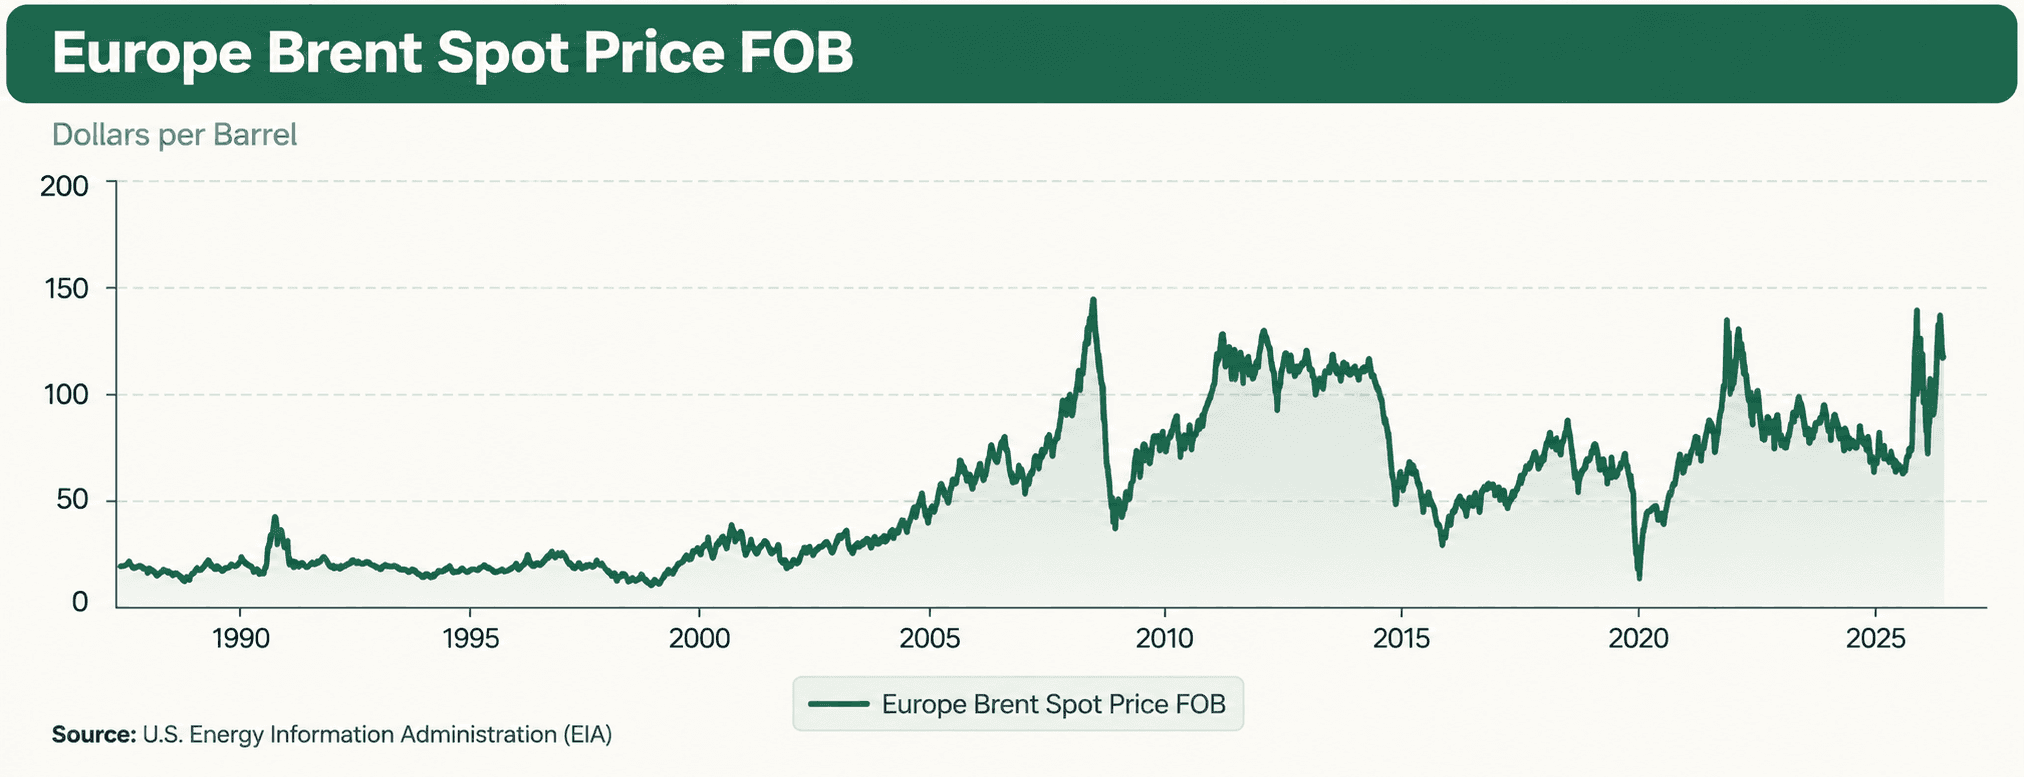
2014–2016: Brent crude fell from about $115 per barrel in June 2014 to below $30 in early 2016.
Source: EIA’s historical Brent prices
Many highly indebted shale producers filed for bankruptcy.
Refiners generally held up better, because lower crude costs supported their margins.
Many fee-based midstream companies continued paying distributions, although some with weaker balance sheets did not.
2020: Pandemic lockdowns collapsed fuel demand.
On April 20, 2020, the May WTI futures contract settled below zero for the first time.
ExxonMobil reported an annual loss for 2020 but maintained its dividend.
SLB cut its quarterly dividend by 75%.
Refiners were hit hard as gasoline and jet fuel demand fell.
Past downturns demonstrate why financial strength matters when evaluating oil stocks. Companies with manageable debt, efficient operations, and reliable cash flow may be better positioned to withstand falling prices and declining demand. However, even well-established energy companies can experience significant losses during severe market disruptions.
Are Oil Stocks a Good Investment in 2026?
Oil stocks may offer opportunities for investors seeking growth, dividend income, or exposure to the energy industry. However, strong performance in 2026 doesn't necessarily mean these stocks will continue delivering attractive returns.
Higher oil prices can increase profits for some energy companies, but commodity prices are unpredictable. Geopolitical developments, changes in global demand, production costs, and government policies can all affect future earnings and stock prices.
Investors should also consider a company's financial strength, dividend history, operating efficiency, and current valuation. An oil company with a lasting competitive advantage may be better positioned to withstand market downturns, but even financially strong companies can be poor investments when their shares are overpriced.
Rather than focusing exclusively on recent stock performance, investors can use the following six questions to evaluate individual oil stocks and their long-term potential.
Six Questions to Ask Before Investing in Oil Stocks
1. What happens to this business if oil returns to $60?
A company that remains profitable and maintains its dividend at lower prices has a different risk profile from one that needs today's prices.
2. Does it earn money from price or from volume?
Producers’ earnings depend on realized commodity prices, production volumes, and costs.
Midstream operators often earn contractual fees tied to capacity or throughput.
Refiners depend on the difference between refined-product selling prices and crude acquisition costs, after accounting for operating expenses.
3. What has its return on invested capital looked like over a full cycle?
A single year of high returns during a price spike says little. A 10-year average that includes downturns says more.
4. How strong is the balance sheet?
Low debt allows a company to keep investing and paying shareholders through downturns rather than being forced to cut.
5. How is management using today's windfall?
Paying down debt, repurchasing shares at reasonable prices, and maintaining spending discipline are different choices from expensive acquisitions made at the top of a cycle.
6. What expectations are already reflected in the share price?
Business quality and investment value are separate questions.
A durable company can produce disappointing shareholder returns if purchased at an excessive price. In cyclical industries, unusually strong earnings can also make a price-to-earnings ratio look deceptively low. Comparing valuation with earnings and cash flow under more normal conditions provides additional context.
TCR Education Corner
A Tailwind Is Not a Moat A rising oil price is a tailwind, a favorable market condition that can temporarily increase a company's profits. An economic moat is a lasting competitive advantage that can help a company remain profitable even when market conditions change. Investors can look for evidence of a moat by comparing a company's financial performance during periods of high and low oil prices. Companies that consistently outperform similar competitors may have advantages worth investigating. |
Related Market Insights
Is the Stock Market in a Bubble in 2026? What 2006 and 2017 Can Teach Investors
Undervalued Index Funds: Areas of the Market Trading at Lower Valuations
Frequently Asked Questions
Are oil stocks a good investment in 2026?
Energy stocks have rallied sharply during 2026, alongside disruption to oil flows and changing commodity-price expectations. Whether an individual company represents an attractive investment depends on its valuation, costs, financial strength, and prospects across the cycle.
Prices driven by geopolitical events can reverse quickly.
What are the best oil stocks?
There is no single list of best oil stocks for every investor. A more useful approach is to understand which part of the value chain a company operates in and where its competitive advantage comes from. Low-cost producers, fee-based pipeline operators, complex refiners, and technology providers each carry different risks and respond differently to oil price changes.
What is the difference between upstream, midstream, and downstream?
Upstream companies find and produce oil and gas. Midstream companies transport, store, and process it. Downstream companies refine it into fuels and chemicals and sell finished products. Some large integrated companies, such as ExxonMobil and Chevron, operate in all three.
What is an economic moat?
An economic moat is a durable competitive advantage that lets a company earn returns above its cost of capital for many years. In energy, moats usually come from low production costs, hard-to-replicate infrastructure, complex facilities, or proprietary technology rather than from brand or pricing power.
How does the Strait of Hormuz affect oil prices?
In 2024, oil passing through Hormuz was equivalent to approximately 20% of global petroleum-liquids consumption. The strait also carried approximately 20% of global LNG trade.
Disruptions reduce available supply and add a risk premium to prices. Because alternative export routes have limited capacity, prolonged disruption tends to keep prices elevated.
A Final Word
Oil stocks have attracted considerable investor attention in 2026, but recent gains don't guarantee future performance. The energy industry includes businesses with different revenue models, competitive advantages, and exposure to changing commodity prices.
Understanding those differences, reviewing historical financial performance, and evaluating stock valuations can help investors make informed decisions.
As geopolitical conditions and energy markets evolve, investors should consider both the opportunities and risks rather than relying on short-term price movements.
Important Disclosures & Financial Disclaimer
Educational Purposes Only
TrustedCompanyReviews.com (TCR) is a publisher, not a registered investment adviser. This article is for informational and educational purposes only and does not constitute personalized financial, legal, or investment advice. All investing involves risk, including the possible loss of principal. Past performance is not indicative of future results. Companies mentioned are examples used to illustrate business models and are not recommendations to buy or sell any security.
Market prices, returns, and production figures are date-stamped because they change over time. Readers should verify current information independently before making financial decisions.
Conflicts of Interest
Contributors hold long positions in some companies discussed. The companies are presented as examples of different energy business models, rather than as a ranked investment list. Ownership creates a potential conflict of interest that readers should consider when evaluating this commentary.
Sources
Morningstar — Profitability & Efficiency annual return on invested capital figures for the companies discussed. Five- and ten-year arithmetic averages calculated from fiscal-year observations for 2021–2025 and 2016–2025, respectively. Compiled October 21, 2026.
U.S. Energy Information Administration — October 2026 Short-Term Energy Outlook. September Brent prices and fourth-quarter forecasts. The linked report updates monthly.
U.S. Energy Information Administration — Oil flows through the Strait of Hormuz.
U.S. Energy Information Administration — LNG trade through the Strait of Hormuz.
State Street Investment Management — Energy Select Sector SPDR Fund (XLE). Year-to-date NAV total return through September 30, 2026.
State Street Investment Management — SPDR S&P 500 ETF Trust (SPY). S&P 500 benchmark total return through September 30, 2026.
ExxonMobil — Second-quarter 2026 earnings release.
Enterprise Products Partners — Fourth-quarter and full-year 2025 results. Distribution growth and coverage.
SLB — Second-quarter 2026 results. Regional operating conditions.
SLB — First-quarter 2020 results. Historical dividend reduction.
U.S. Energy Information Administration — Historical daily Brent crude oil prices.
U.S. Energy Information Administration — Explanation of negative WTI futures prices in April 2020.
U.S. Energy Information Administration — U.S. refinery construction and capacity expansion.

Written by
Deane Biermeier
Contributor: CEO - Trusted Company Reviews
Paul J Paquin